Monday, July 9, 2012
TMP36 Temperature Data Logger
In this blog I use a simple 3-pin Centigrade temperature sensor, TMP36 (in a TO92 package) as input to the data logger. One pin connects to ground, one to +5V, and the third to the analog input of the DAQ.
I simply want to demonstrate the system's ability to record a series of temperature readings and to display them in a graph. To make the graph interesting, I will hit the sensor with freeze spray, followed by a heat gun.
LabView is a graphical automation program. The programmer works from 2 main screens: the 'front panel' on which virtual instruments, displays and buttons reside, and the 'block diagram' in which graphical coding takes place. The big grey rectangle that encompasses several icons in the white-space above is in fact a software loop. Loops are used to repeat functions (in this case, measurements) indefinitely. The first blue box to the left represents the analog voltage measured by the myDAQ. At room temperature it reads 750mV. According to the temp sensor's data sheet, the TMP36 has an offset voltage of 500mV; with scaling of 10mV/degC. The easy conversion of voltage to temperature is .750V - .500V * 100 = degrees C, or 25.0C (standard room temperature). I perform this mathematics using triangular icons for subtraction (with a constant of .5) and multiplication (with a constant of 100). The second blue box is a 'write to measurement file' icon, which actually does create a TDMS file on my laptop computer. All of this takes place inside of the loop (at a thousand samples per second). The third blue box, situated outside of the loop, is the 'read from measurement file' icon, which when the stop button is depressed, it reads back the stored data. This is wired to a graph icon, which displays the data graphically. It may sound silly; but this kind of graphical programming is extremely powerful. I composed this in an hour; were I to attempt the same using any other common programming language; it would have taken at least a week.
TMP36 Sensor from Digi-Key [Link]
Picture of Test Setup [Link]
Program Up Close [Link]
My other interests [Link]
LabView Experiments in Automation
Much of my professional work has been in Test Engineering, and the SW tool of choice is hands-down National Instruments LabView for test automation. It is not cheap ($2500 to $4500 for a developer seat); however, it is incredible graphic code, backed by world-class training and technical assistance. LabView is scalable from simple data logging projects to plant automated testing. The Large Hadron Collider runs on it.
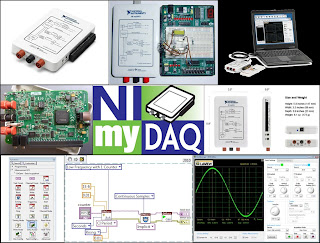
Drivers exist to interface it to all major brands of test equipment, and many user groups exist to help ensure project success. I was extremely fortunate to obtain a student version of LabView and a hardware platform called myDAQ for under $500. MyDAQ is a USB data acquisition module. This is what I use at home to practice coding and to build marketable skills. It is a worthy investment for abilities in high demand.
I plan on using this blog to chart the progress of my automation experiments. It should also serve as an aid to other enthusiast starting out with LabView.
National Instruments myDAQ [Link]
NI Getting Started [Link]
Since myDAQ is only sold to students, do not despair; the NI USB-6008 is available for $169 (plus SW)
[Link]
My other interests [Link]
Subscribe to:
Comments (Atom)

